
Power BI Business Analytic
Project Summary
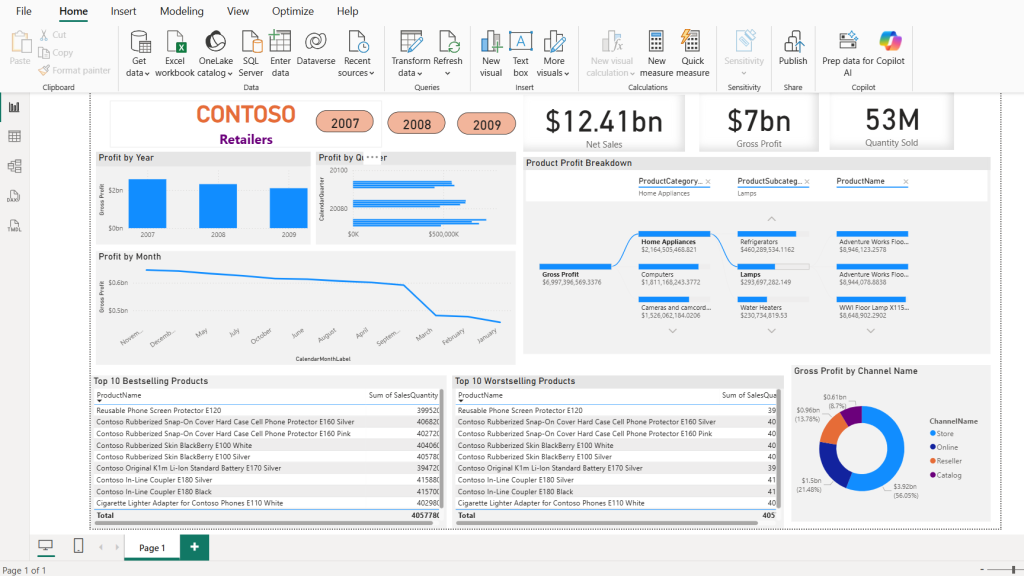
This Power BI project delivers a complete business analytics solution designed to help organizations understand their financial performance, customer behavior, operational efficiency, and growth trends. The dashboard transforms raw datasets into clear, actionable insights using dynamic visualizations, interactive filtering, and automated reporting.
Key Objectives
- Provide leadership with a real-time view of business performance
- Identify trends, risks, and opportunities across sales, revenue, and operations
- Support data-driven decision-making through interactive visual analysis
- Automate recurring reports to reduce manual spreadsheet work
Data Sources
- Excel workbooks (Sales, Finance, HR)
- SQL Database (Customer & Transactions tables)
- CSV imports for marketing and web analytics
- Manual entry datasets (budgets, targets, KPIs)
Core Features & Insights
1. Sales & Revenue Dashboard
- Monthly, quarterly, and yearly revenue trends
- Top-performing products and underperforming categories
- Regional performance comparison
- Sales forecasting using historical patterns
2. Customer Insights Dashboard
- Customer segmentation by demographics and spending behavior
- Customer acquisition vs. retention trends
- Lifetime value (CLV) visualizations
- Churn analysis with risk indicators
3. Financial Performance Dashboard
- Profit & loss breakdown
- Budget vs. actual performance
- Cashflow visibility
- Expense allocation and cost-center analysis
4. Operations & Productivity Dashboard
- Employee performance metrics
- Resource utilization
- Project tracking and completion rates
- Service delivery times and bottleneck identification
Technical Components
- Power Query for ETL (Extraction, Transformation, Load)
- DAX Measures & Calculated Columns for KPIs and custom logic
- Data Modeling: star schema with fact and dimension tables
- Interactive Features: slicers, drill-through pages, cross-filtering
- Automated Refresh: scheduled updates via Power BI service
- Role-Level Security (RLS): different data views for managers, staff, and executives
KPIs Used
- Total Revenue & Revenue Growth %
- Customer Retention Rate
- Gross Profit Margin
- Average Order Value (AOV)
- On-Time Delivery Rate
- Cost per Acquisition (CPA)
Outcomes
- Improved data visibility for decision-makers
- Reduced reporting time by more than 70%
- Early identification of declining product lines
- Better forecasting accuracy and resource planning
- Increased transparency across financial and operational metrics
Tools & Technologies
- Power BI Desktop & Power BI Service
- Power Query (M Language)
- DAX (Data Analysis Expressions)
- SQL Server
- Excel integration
- Cloud-based refresh & dashboards (Power BI Service)
Your Role (Portfolio-Friendly)
- Designed and built the full analytical model and dashboards
- Developed DAX measures for KPIs, time intelligence, and calculations
- Cleaned, merged, and transformed data using Power Query
- Created interactive visuals and RLS-secured views
- Worked directly with stakeholders to capture requirements and KPIs